New Zealand 1995: a Miracle Economy?
© Keith Rankin
Policy Discussion Paper No.19, Department of Economics, University of Auckland, Sept. 1995
Introduction
New Zealand has been subjected to a structural adjustment programme whose purity and zeal is unparalleled.
There is a general feeling that this is the best environment businesses have operated in for the last 40 years. Anything more would be a topping-off.
New Zealand's experience of economic liberalisation over the decade 1985-95 has been marketed to the international community as proof of the efficacy of the neo-liberal policy agenda. While many firms have experienced high levels of profit, profits are not a measure of the collective well-being of New Zealand's resident population. Even when consistent with Pareto optimality - certainly not the case in New Zealand - large gains to a small minority of the population fall short of Miracle status in the eyes of disinterested observers.
New Zealand's simple political structure has made it remarkably easy for radical neo-liberal policies, supported by a small but focussed coalition of business and libertarian interests, to be implemented in the face of the will of the New Zealand public as expressed in the 1984, 1990 and 1993 general elections.2 That coalition is now explicitly represented by a political party, ACT (Association of Consumers and Taxpayers). Despite the fact that ACT is well-known, well-funded and well-suited to the new environment of proportional representation, it has made little impression on the opinion polls (Smellie 1995, p.15).
What are the criteria for a Miracle economy? Hirschman defines economic progress as an "advance towards a just and prosperous society" (1994, p.343). Few would disagree. The key ingredients of a nation's economic success can therefore be summarised as:
An alternative set of criteria is the "magic square" (Rosenberg 1986, p.42) which comprises four criteria of economic success:
For Rosenberg, the simultaneous solution of this four goal "puzzle" was well nigh impossible under the radical neo-liberalism of Roger Douglas, the persona of New Zealand's liberalisation programme which followed the change of government in July 1984. By 1986/87 the economy had regressed on all four fronts simultaneously, yet that year is still seen in retrospect by wage/salary workers as the epitome of prosperity, as the last year of the economic good times. By 1995, however, still under a neo-liberal policy environment,3 New Zealand appears to have come closer than many other developed countries to solving the magic square. Yet only the noisy minority are cheering. Most New Zealanders have worked very hard to achieve only modest gains in their families' living standards. Many are still experiencing declines in their real incomes.
There is clearly a problem with the use of the magic square criteria alone, in that none of them necessarily equate to the achievement of a just and prosperous society. They represent intermediate goals which, according to their political and historical context, can vary greatly in their impact on consumption levels, productivity growth, the distribution of income, as well as on each other.
Economic growth can be rapid simply because past growth rates have been very low, leaving a large pool of underemployed labour that can be re-employed or redeployed with little further investment. Economic growth can also be rapid when low wage rates oblige workers to work longer hours, and induce single-breadwinner families into becoming multiple-earner households. GDP acceleration can co-exist with declining productivity growth if labour supply is also expanding.
On the face of it, a balance of payments deficit - even a long-running deficit - is not a problem, in that it allows a community to live at a higher average standard of living than its productivity levels justify.4 Certainly, running a surplus to reduce indebtedness is not a particularly useful goal if the policy settings used inhibit economic growth. The debt-GDP ratio can rise despite a fall in accumulated debt, if GDP is falling. A succession of current account deficits need not inhibit GDP growth, but will nevertheless compromise living standards by inhibiting GNP growth. The underlying problem is that residents of an indebted country - or a country with a disproportionate amount of its territorial assets subject to foreign ownership - may become obliged to produce a tithe of goods and services for foreign residents to consume. One hundred years ago, Frederick Joseph Moss (1897, p.198), a New Zealand writer and former Member of Parliament noted that a sustained balance of trade surplus was a matter for concern.
Whenever in a country, old or new, the exports persistently exceed the imports, the case calls for prompt and searching enquiry. Either the exports are selling at a loss or there is a great drain upon them for the payment of interest on debts, or meeting the expenditure of absentees [my emphasis], or, it may be, for paying debts public or private.
A simple causal relationship from price stability (however defined) to high rates of productivity growth has never been established. Nor has a functional relationship from price instability to diminished long-run productivity growth been demonstrated.5 The impact of any particular bout of inflation (or deflation) has always depended on the context from which that inflation emerged. Correlations are not causal relationships.6 Anti-inflation policies may disturb hitherto observed relationships or have side-effects which damage the achievement of the final goals more than price instability does. Furthermore, it is very difficult to measure the ceteris paribus success of anti-inflation policies with respect to the ensuing inflation rate, because it is impossible to establish what the inflation rate would have been in the absence of the policy.
Full employment - as inferred from official unemployment statistics which ignore discouraged workers and the many facets of underemployment - can arise from policies designed to make labour cheap and flexible, to the detriment of workers' living standards and labour productivity growth. Problems in assessing the efficacy of the labour market can compound because of the frequent coincidence of overemployment - additional workers, long hours at low rates of pay, unpaid overtime - with underemployment. The two effects do not cancel out; rather each is a source of diminished living standards. Work and searching for work are costs, not benefits.
Of course, the final goals that a disinterested economist identifies as representing a nation's well-being may not be the only goals by which a set of policies should be judged. Probably all economic policies involve unstated or understated goals which reflect the interests of influential subsets of any nation's set of stakeholders.7 Policy programmes have to be assessed in terms of all the outcomes that do eventuate as well as whether the policies achieve their publicly stated goals. Alan Budd, former adviser to Britain's Heath and Thatcher Governments expresses the matter this way, with respect to his role in the implementation of a neo-liberal policy programme:8
The nightmare I sometimes have about this whole experience runs as follows: I was involved in making a number of proposals which were partly at least adopted by the government and put in play by the government. My worry is as follows; that there may have been people making the actual policy decisions, or people behind them, or people behind them, who never believed for a moment that this was the correct way to bring down inflation. They did however see that this would be a very good way to raise unemployment. And raising unemployment was an extremely desirable way of reducing the strength of the working classes; if you like, that what was engineered there - in Marxist terms - was a crisis of capitalism which recreated the reserve army of labour.
It may be that New Zealand's neo-liberal reforms had only one underlying goal, to raise the rate of return to private capital. If that is the case, and if that is a sufficient criterion for success, then New Zealand may well have achieved an economic Miracle in the early-1990s.
Gross Domestic Product
This is the fastest sustained growth we have ever had.
By managing its economy more effectively than [Australia has] since 1988, by undertaking courageous steps towards reform and opening up its economy to the world, and by dealing roughly, though at some considerable cost, with the cosy institutions of the past, it shows every sign of being on the brink of overtaking Australia perhaps before the centenary of Federation in terms of living standards and economic performance.
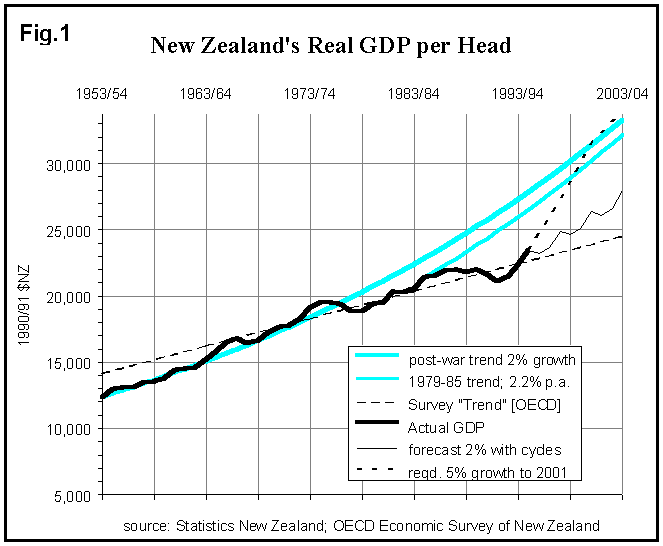
In the introduction to its recently published Economic Survey of New Zealand, the OECD presents (OECD 1994, p.12), in a section subtitled "A strong recovery", a graph depicting what is claimed to be an historical growth trend. By simply drawing a line between 1966 and 1993 real GDP statistics, the authors claim that New Zealand has returned to its historical growth path. The "trend" presented is an arithmetic one, indicating a long-run annual increase in GDP of NZ$1,600 million and implying a diminishing annual per capita growth rate that has fallen to below one percent.
The authors of the OECD report are concerned that future above-trend growth might constitute overheating. They support the New Zealand Reserve Bank in taking pre-emptive action to dampen down the economy (Wood 1995, p.C1), suggesting that monetary policy should "err on the side of caution" and that the complementary role of contractionary fiscal policy is "crucial" (OECD 1994, p.108). There has been a desire by the National Government to overstate the economic growth performance in order to justify policies designed to reduce the growth rate. New Zealand's 1990s' growth resurgence has been ordinary by historical standards, the Prime Minister's claims notwithstanding (Rankin 1995a, Fig.1, p.8; Bayliss 1994, p.111).
Figure 1 shows New Zealand's post-war growth trend. From 1953 to 1976, there was a full employment trend rate of two percent per annum. Growth was slow, however, by international standards; from 1960 to 1973 New Zealand fell from 9th to 18th place in the OECD League Table of comparative incomes (Dowrick and Nguyen 1989, p.36). Nevertheless, this modest historical growth is well in excess of that claimed by the OECD. Monetary and fiscal policy settings implemented in 1994 and 1995 ensure that slow growth will remain the norm. In 1985, New Zealand's average GDP per capita was 84% of Australia's.11 Subsequent growth in both countries has brought that ratio down to 80%, with the consumption gap even greater. New Zealand will require per capita growth of four percentage points above Australia's each year to 2001 if it is to catch up with Australian living standards.
Reserve Bank Governor Don Brash (1995, p.9) recognises that an appropriate growth rate for a country depends on historical context. For example "Asian Tiger" countries can experience rapid growth (ie 8-10% per annum) because relatively backward economies can procure big improvements in labour productivity that are available only to countries undergoing "catch-up" structural change. In making his point Dr Brash effectively explained why New Zealand's post-war growth rate has been significantly slower than the OECD average. The West European Miracle economies, completing in the 1960s an industrialisation process that began in the nineteenth century, took advantage of growth opportunities not available to New Zealand. In experiencing comparatively slow growth, the New Zealand economy was not necessarily performing badly in the 1950s and 1960s, despite the assertions of advisers with agendas to push (eg Crocombe et.al. 1991). The fact that the cyclically unadjusted 1994 growth rate has exceeded that of many other OECD countries does not make New Zealand a Miracle economy. The idea of New Zealand as an economic tiger has nevertheless been taken up by Rowan Callick in the Australian financial press (misconstruing Brash's main point which was to explain why New Zealand was not like East Asia) and also by Australian journalist Alan Wood (1995, p.C1).
New Zealand's GDP remains well short of its potential, given its benign natural environment and Pacific rim location, the skills of New Zealanders at home and abroad, and the skills of immigrants. Having undergone a significant degree of liberalisation and restructuring before 1984, New Zealand has for some time had unrealised growth capacity. Export-oriented manufacturing grew rapidly during the years of high oil prices and world recession. New Zealand's 1990s' growth rate should be considerably higher than the post-war average, because growth was so slow in the late-1980s and because New Zealand manufacturing was able to profit from the development of advanced technological and business skills that characterised the 1960s and 1970s (the "learning curve" or "infant industry" decades). Unfortunately for New Zealand, many of those who gained management and technical expertise had to emigrate in order to make full use of their skills. Figure 1 clearly reveals the two structural breaks in New Zealand's growth path, at 1977 and 1987 (Easton 1994b, p.62). The late-1980s saw a switch back to a greater reliance on primary production as in the years before 1977, with diminishing addition of value before export.
The structural recession of 1985 to 1992 was essentially a crisis of manufacturing, including primary product processing. The structure of demand in New Zealand has been transformed as a result of this long recession, and the manufacturing revival of 1992-95 reflects this. New Zealand manufacturing is now oriented towards affluent markets - including Australia - rather than the working-class markets which dominated during the import substitution phase. The vision of the more erudite of the nineteenth century protectionists (Rankin 1991) - that New Zealand's economic future lay in the production of quality manufactures in a multilateral trade environment - has been proved valid. So has their fear of New Zealand becoming a low-wage economy.
Balance of Payments
As Sir Roger [Douglas] sees it, it isn't logical to argue against flogging off the family silver if, in the next breath, you're talking about running a balance of payments deficit. The economics are simple, Sir Roger says. If you spend more than you earn, you have a deficit. When you have a deficit, you have to use your capital - your savings. If you don't have any savings you borrow from foreigners. "That's called selling your country."
[Trade Minister] Burdon didn't say so, but the Government policy is to balance deficits in the current account through the capital account. This is done by building up overseas debt or by selling Kiwi resources to foreigners.
Despite various means to maintain full employment while rationing imports, New Zealand's economic growth has traditionally been curtailed by cyclical balance of payments problems. Balance of payments constraints were seen by the Muldoon administration of 1975-84 as a crucial impediment to growth, having become structural rather than cyclical. They are seen today as such only by the Alliance, the only major political party advocating an approach to economic management that is not neoclassical.12 Following the exchange rate float of March 1985, the balance of payments problem came to be regarded by neo-liberals as one that could be ignored. That mindset is still present amongst New Zealand policymakers (protestations of concern about "selling your country" by Sir Roger Douglas notwithstanding) who are willing to impose burdens on the tradeable sectors as a price for their inflation-curbing priorities.
This neo-liberal approach to the balance of payments is reflected in the 1989 Reserve Bank Act (RBA). The RBA effectively requires the central bank to induce a capital inflow in order to run an exchange rate that suppresses inflation. Without many explicit statements saying so, the policy has been to finance balance of payments deficits - indeed to induce deficits - via expensive short term capital inflows and via foreign direct investment (including foreign purchases of public assets that do not in themselves constitute capital formation). A balance of payments deficit need not be a result of national profligacy; a current account deficit is the inevitable result of a capital account surplus. A country that seeks a net inflow of foreign capital, if successful, must run a balance of payments deficit. "Selling your country" or raising interest rates may be the cause of a current account deficit, not the result.

Despite the low priority given to balance of payments' issues, some adjustment towards external balance has taken place, through an effective wage freeze in the public sector combined with the contractionary income effects of the 1991 Employment Contracts Act and the 1991 social welfare benefit cuts. Imports of both consumption goods and investment goods have been significantly curtailed as a result of falling real wages. If the New Zealand economy was to return to full employment with 1984 levels of income distribution, the current account deficit would become much higher than it was then. While New Zealand manufacturers now cater for the top end of the market, low income recipients consume imports.
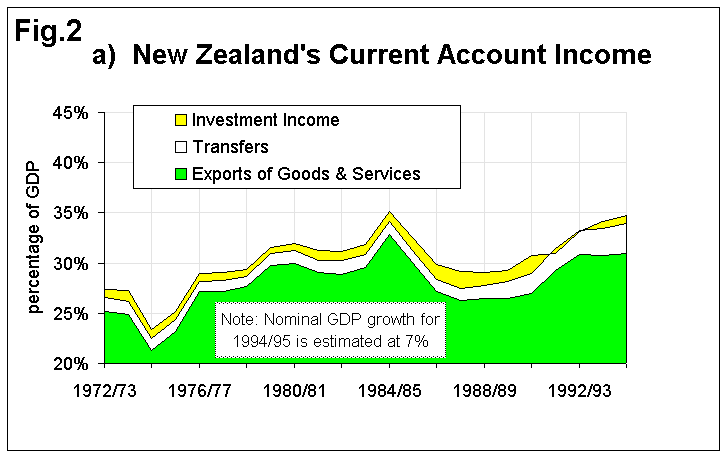
One factor that is keeping the current account deficit in check is a big surplus on international transfer payments. This is mainly due to New Zealand's immigration programme. Such transfer income is likely to diminish because immigration criteria are in the process of being tightened, and because net migration is a highly cyclical feature of New Zealand's economy, driven to a large extent by New Zealanders living abroad.
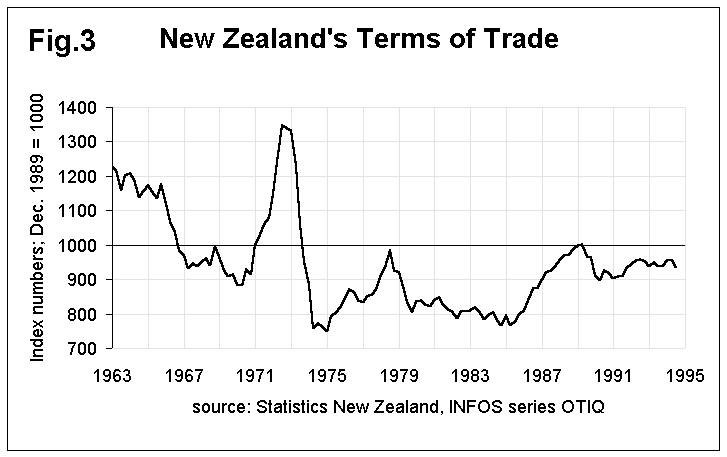
Figure 2 shows the two sides of New Zealand's current account. The balance of payments problem of the 1970s was a result of a fall in the prices of staple exports coinciding with a dramatic rise in import prices. Figure 3 shows New Zealand's terms of trade from the early-1960s. One of the excuses for the poor performance of the New Zealand economy has been the terms-of-trade impact of Great Britain's entry into Europe. In fact the relative prices of New Zealand's exports are the same in the 1990s as they were before Britain's entry in 1972.
The underlying export problem is now worse than it was in 1984/85, because the decline in traditional staple export sectors (which consumed much of their capital stocks in the late 1980s) has only just been compensated for by manufactured exports which were expanding regardless of liberalisation. Exports of both pastoral and manufactured products would have been at much higher levels in 1995 if liberalisation had been allowed to continue at the pre-1984 pace. New Zealand's export growth has not kept up with world market growth since 1985, in contrast to the experience of the previous decade.
On the import side, New Zealand's problem was its large bill during the period of very high oil prices. Exports then grew in response to the growing import bill, despite world recession, but not quickly enough to avoid an escalating debt-servicing problem. That problem was a result of high world interest rates as much as of high debt levels. It was resolved not only by reduced oil prices from 1986, but also by a considerable amount of import substitution in the energy sector made possible by projects which commenced during the early 1980s.
From 1985 to 1988, the tradeable sectors experienced a sharp decline. Very high interest rates added to business costs while inducing a huge rise in the real exchange rate. In addition, the pre-1984 program to reduce tariffs and remove import quotas was rapidly accelerated. Imports fell as the demand for imports proved to be more income elastic than price elastic. Indeed the Summers and Heston index of "trade openness" fell during the period of major tariff cuts.13 Import volumes increased, however, thanks to lower import prices and the influx of capital taking advantage of high interest rates and minimal financial controls.
There has been no boost to trade resulting from liberalisation. New Zealand has experienced neither growth-driven trade nor trade-driven growth (Bradford 1994). Exports recovered in the 1990s to the same share of GDP as in the pre-liberalisation period, but only as a result of a sharp GDP fall in 1991/92 and a favourable terms of trade experience compared with, for example, Australia (Bayliss 1994, Fig.26, p.104; Easton 1994a, p.56). While the balance of payments deficit has been reduced compared to the period of historically low terms of trade in the early 1980s, the trend in 1995 is for the huge deficit on foreign investment income to be funded by more capital imports. Since 1991 the deficit on investment income has risen to record levels relative to GDP, despite rapid recovery growth and lower world interest rates than in the early-1980s. The prospect of New Zealand's exports being able to pay for its imports as well as service its liabilities looks more remote than ever.
Inflation
Goodhart's Law said that if ever the Government decides to rely on any particular statistical relationship as a basis for policy, then, as soon as it did that, that relationship would fall part.
The economy did not behave in the way that monetarists predicted. The squeeze on money led to a wave of factory closures while inflation continued to rise. ... Even more mystifying was the behaviour of the money supply. Despite the squeeze it was still growing, something the monetarists thought impossible. ... Inflation did [eventually] fall, but the money supply continued its mysterious rise. It became clear that the fundamental law of monetarism - the relationship between the money supply and inflation - didn't work. Ever so quietly, this solution to Britain's problems was discarded.
We cannot be completely certain why inflation became public enemy number one in New Zealand in 1989. It may have had something to do with the embarrassing record on inflation in the early years of liberalisation (1985-87). The main objective of the 1989 Reserve Bank Act may therefore have been political; by giving the Reserve Bank both independence and a politically sensitive policymaking role, the government could avoid blame for any unpopular outcomes arising from the liberalisation process while making it harder for future governments to reverse the process. Thus, the desire to target inflation can be seen as having been an excuse for implementing as legislation a particular piece of neo-liberal doctrine - the Reserve Bank Act - rather than a genuine belief that inflation at three, four or five percent was New Zealand's predominant economic problem. The RBA, while strongly opposed outside of Parliament, was supported by both major parties.
The RBA effectively defines the term price instability as being any underlying inflation outside of the zero-two percent range.15 It is not clear to what extent price instability has been or might be detrimental to productivity growth. The Reserve Bank Governor, in media interviews,16 says only that "there is no evidence that inflation is beneficial to growth". He concedes that the inflation management activities of the Bank - which involve the manipulation of short-term interest rates as a means of setting the exchange rate - tend to have a negative impact on short-run growth.17
An interesting feature of the Reserve Bank Act is that the Bank must target "underlying inflation" and that the Reserve Bank itself is free to both define and measure underlying inflation. Thus the Bank uses a doctored version of the consumers price index (CPI) as the yardstick for monetary policy (Roger 1994). The CPI is modified by the Reserve Bank ostensibly to remove the inflationary effects of rising interest rates, but in fact other amendments have been made, especially to account for "relative price shocks". Statistics New Zealand give the CPI inflation rate in the year to June 1995 as 4.6%, 2.7% excluding credit services. The Reserve Bank, by also eliminating volatile components, claim that the underlying rate of consumer price inflation is 2.2%. With labour cost increases at 1.4% for the year (INFOS series LCI) and an exchange rate appreciation of 7.7%, even 2.2% inflation represents a poor performance.
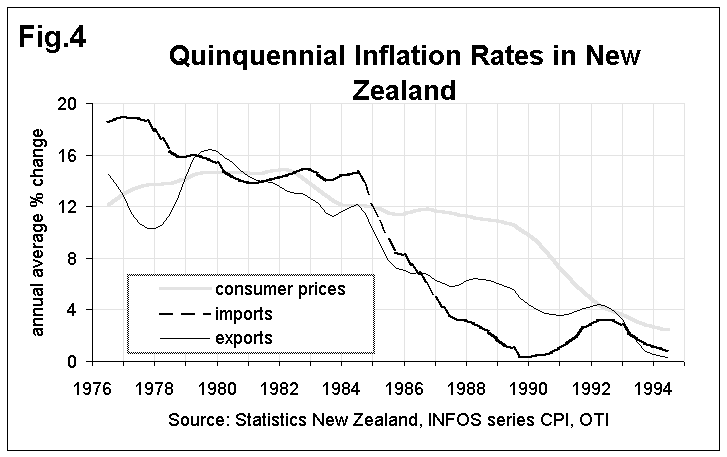
We cannot assert with any confidence that New Zealand prices are lower - or more stable - than they would otherwise have been in the absence of liberalisation in general and the Reserve Bank Act in particular. Prior to the currency float in 1985, New Zealand's consumer price inflation rate could be predicted by OECD G7 inflation rates the year before, with an adjustment for that fact that small OECD countries tended to have higher inflation rates than the major economies. In the years from 1975 to 1984, import and export prices increased at about the same rate as consumer prices (Figure 4). Finance Minister Muldoon imposed a 20-month price and wage freeze from June 1982, which probably did no more than cause 1983 inflation to be lower than it would otherwise have been, and 1984 inflation to be higher than otherwise.
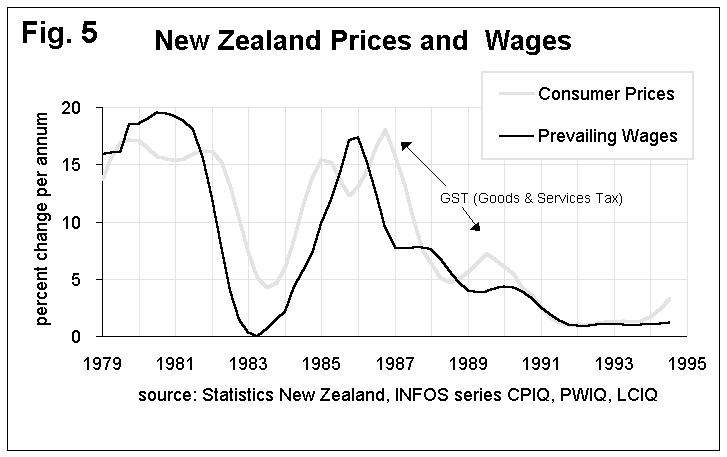
In late 1984, inflation was forecast to be about 10% in 1985.18 However, in 1985 producer prices and then consumer price rose much faster than that. This unanticipated rise in prices followed a very modest wage round, and could not be explained by the effects of the July 1984 devaluation which were already built into the forecasters' models. Inflation in New Zealand in the post-liberalisation period was attributed to non-wage domestic costs. Wage increases in 1986 followed, rather than led the inflation resurgence (Figure 5). An examination of the public sector accounts, the national accounts and the producer price index suggests that the costs of public administration, financial and business services, and housing were the culprits.19 High interest "tight" monetary policies (attracting foreign inflows) combined with finance sector deregulation made the cities of Auckland, Wellington and Christchurch awash with money while the tradeable sectors were obliged by market discipline to lower their prices. This "scissors effect" on exports and import substitutes was reinforced by the need for the struggling sectors to purchase greater quantities of financial and business services in order to remain liquid and to market their products.20 Indeed, in 1995 there is a court action by farmers and other producers who were persuaded to respond to high interest rates by buying financial services that involved considerable foreign exchange risk (Chisholm 1995, p.A8).
New Zealand retains that 1980s' legacy, in that domestic prices have remained high relative to traded goods' prices. Indeed the gap is widening again, with consumer prices 4.6% higher in June 1995 than a year earlier. The export inflation rate is -1.1%, with -0.9% for imports. New Zealand's inflation problem is the widening gap between the prices of traded goods and non-traded goods, and the gap between prices and wages. Low inflation can be too high.
As an example of Goodhart's Law, the traditional relationship between the producers price index (PPI) and the CPI has been broken (Rankin 1995b, Fig.1), following the introduction of the Reserve Bank Act. The PPI, a better guide to underlying inflation than the CPI, shows that inflation was close to three percent in 1992 and 1993, and has fallen consistently from September 1993 to June 1995, despite high economic growth. Likewise the implicit price index for private consumption fell to 0.4% per annum in the year to September 1994.21 Despite these falling inflation numbers, monetary policy has firmed consistently since August 1994. Monetary policy is being implemented to suppress growth, not rises in the cost of living. The rise in the CPI towards annual rates in excess of four percent commenced only after the sharp firming of interest rates.
Statistics New Zealand has recently published a "Superannuitants Price Index" (SPI), including an index for pensioners living in rented properties. The SPI has a very low weighting for interest rates. Using the weightings given by Statistics New Zealand, it is possible to backdate the SPI for renters, and to use it as a more general index for people living on the line of relative poverty. This index - we can call it the BPI (Beneficiaries Price Index) - shows that low income renters have faced higher inflation rates than average, mainly because they did not benefit from falling interest rates in the early-1990s (Rankin 1995c). Their situation has however been offset in part by a new way of targeting welfare to low-income recipients - the Accommodation Supplement - which came into force in 1993. The replacement of publicly provided housing with an income supplement has removed an element of price stability from the housing market at a time when increasing numbers of people, dependent on irregular incomes, are seeking rental accommodation. Landlords may prove to be the principal net beneficiaries of this new housing benefit.
In New Zealand in the mid-1980s the policies which were being discarded in the United Kingdom proved to be even more dramatically counter-productive. Yet, rather than being discarded, they have become enshrined in law. New Zealand's inflation problem - increases in non-wage domestic costs - has not been addressed, let alone solved, by the Reserve Bank Act. Attempts to suppress inflation by appreciating the currency are having a deflationary effect on the real economy, preventing economic activity from getting anywhere near to New Zealand's production possibilities frontier. While it is too early to see the impact of 1994/95 monetary policy on growth rates, surveys of business confidence took a sharp turn downwards in February (NZIER 1995, National Bank 1995).
Labour
Unemployment is essentially a political choice.
There is no doubt that the Employment Contracts Act has altered the balance of power between employers and employees in favour of employers.
New Zealand has a post-war history of high employment and low unemployment rates, although the unemployment register - New Zealand's official unemployment measure until 1985 - significantly underestimated unemployment as measured by the quinquennial census (Rankin 1993b, p.224). Some have argued that the historical pattern of unnaturally low unemployment was in itself a problem, in that it was the result of costly protectionism and public sector featherbedding as well as being a source of inflationary pressure. While this argument may contain elements of truth, the cost of government activities has not fallen as a result of the retrenchment of the public payroll.22 Whether or not economic efficiency fell short of "first-best" in the 1960s, full employment did act to ensure that New Zealand was an inclusive egalitarian society.
Economic inactivity is a superset of unemployment. The aspects of joblessness which are least understood and least adequately quantified by official statistical sources tend to fall outside unemployment as measured by national household surveys. Furthermore, major discrepancies between census and survey employment data, suggest that official (ie surveyed) unemployment rates have been understated since 1986. Unlike in Australia (OECD 1994b, p.455), labour force data is not revised to conform with census data. Statistics New Zealand suggest that survey data may be more accurate than census data (Dixon 1993). I find their arguments unconvincing.23
Officially, unemployment was 161,000 in early March 1991, the week of the last census. The census figure, not comparable with earlier census data, was 164,000. However unpublished census figures show that at least 72,000 people who were receiving an unemployment benefit at the end of February were not included in the 164,000. Therefore, 226,000 people were unemployed in that they met either the tough census criteria or the tough Social Welfare criteria. With numbers of registered unemployed 156,000 and the numbers on the unemployment benefit at 135,000 in June 1995 (compared to an official unemployment total of 106,000, 6.2% of the labour force) it is likely that true unemployment rate remains over 10%.
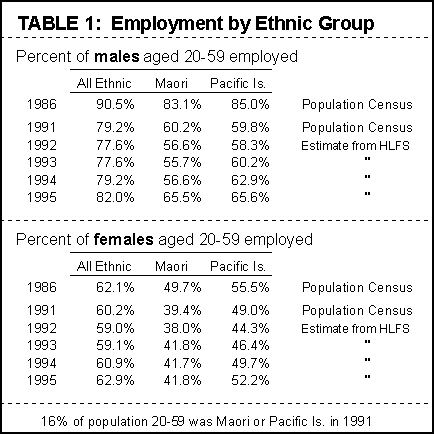
The Household Labour Force Survey (HLFS) shows that, in June 1995, 285,000 people - more than 12% of the population aged 15-64 - were neither employed24 nor students nor retired nor caregivers of children. The proportion of these who are male, Maori or of Pacific Island descent has risen dramatically since 1986 (Table 1).25 It is unlikely that many of these statistically invisible males have the assets, credit facilities or intra-family transfer arrangements that make it practical for them to choose to lead a leisured life while waiting for the wage rate to pick up. It is more likely that most of these discouraged workers have been trapped into welfare dependency (Preston 1995, p.2). Many show up as sickness beneficiaries (trebled in 10 years), invalids beneficiaries (doubled in 10 years) or as recipients of accident compensation (who have been much slower to return to the workforce in the 1990s than in the past).
Economic inactivity is a basic source of social discord. Many New Zealanders are now caught in poverty traps resulting from low wages, a work environment characterised by increasing temporary and part-time work, high abatement rates for income assistance and increasing tax surcharges. The welfare community is a numerically stable underclass largely impervious to recent economic growth (Rankin 1995d). The Government is acutely aware of the problem (Birch 1995, Preston 1995) which causes many beneficiaries and low income families to face effective marginal tax rates (EMTRs) of 60-110%. So far, it has shown little imagination in addressing the problem.
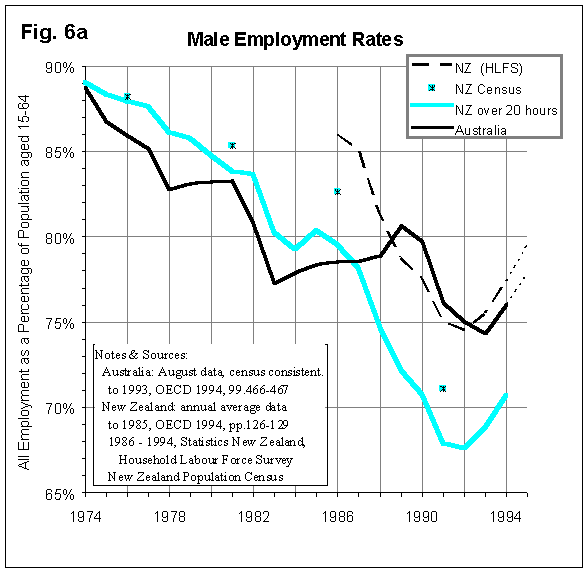
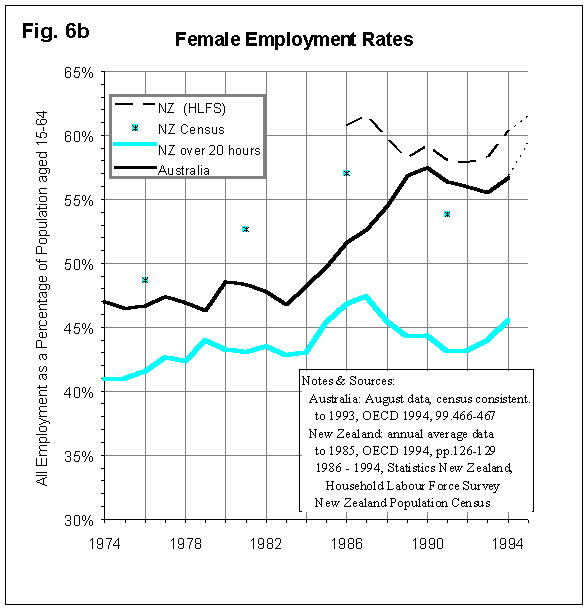
Full employment does not necessarily mean high employment. Nevertheless, unless it can be established that people who are withdrawing from the labour market are doing so because increased leisure is more valuable to them than increased income, we must assume that high employment rates are the best indicator of a successful labour market. One way to get a realistic picture is to focus on the rate of employment with respect to the working age population, rather than on an unemployment rate that is often more sensitive to job search activity than to joblessness.26 Figure 6 shows employment levels as a percentage of the working age population in New Zealand and Australia.
It is clear that New Zealand's employment record was much worse than Australia's in the late 1980s leaving true employment rates lower through the 1990s so far. The official statistics do not show this, because the New Zealand labour force survey consistently overstates employment levels. The gap between census and HLFS employment rates represents the extent of that overstatement. In New Zealand, the collapse of male employment rates was particularly marked. Based on census results, we can say that about 76% of males were employed in 1995, down from 83% in 1985. That compares to 78% in Australia. For females, the New Zealand employment rate is 57%, compared to 59% in Australia.
While unemployment remains a very serious problem, so does underemployment. The 1990s has shown an increase in part-time workers wanting to work more hours.27 An equally important aspect of underemployment is the tendency for people to accept jobs for which they are overqualified (Edlin 1995b, p.2). There has been a significant growth of unemployment amongst the young, whether skilled or unskilled. A disproportionate share of the employment growth in the 1990s has been among older workers who tend to have more experience but fewer formal qualifications. This problem faced by inexperienced young people has been reinforced by the recent increase in the age of pension entitlement from 60 to 65 causing many older workers to delay retirement.
1991 saw the introduction of the Employment Contracts Act (ECA), ending an era lasting 97 years in which labour markets were regulated through national awards and compulsory arbitration. The 1991 legislation, introduced at a time of high and rising unemployment, was primarily an attempt to raise New Zealand's international competitiveness by reducing labour costs; ie as an alternative to the reflationary route of exchange rate depreciation. As such, its implementation was accompanied by an across-the-board reduction in social welfare benefits, which, because they were indexed to prices at a time of falling real incomes, were seen as having become too close to market wage rates (Kelsey and O'Brien, p.4).
In New Zealand, employers have historically favoured whichever wage-setting system gave lower wages. The award and arbitration system was set up at a time when there was consensus between employers and workers, due to the impact of New Zealand's "Long Depression" of 1879-1895. By the late 1900s and early 1910s militant labour opposed the award system while employers supported it (Deeks 1989, p.34). In the late 1920s the exact opposite was the case, with employers wanting to abolish compulsory arbitration (Rudman, p.65). In the 1960s the employers clearly gained from award wage-fixing procedures that made no allowance for economic growth. The system started to fall apart in 1968 (Deeks 1989 p.40), to the eventual chagrin of employers, as the result of the Arbitration Court judge refusing to grant the usual cost of living wage order. The next five years saw an explosive growth in real wages; a realignment with market forces. By 1990, following several years of negative per capita growth and despite significant falls in workers' real disposable incomes, market conditions clearly indicated that the abolition of national awards, compulsory arbitration and trade union rights would lead to reduced real earnings for almost all wage earners and many salary earners. The ECA needs to be seen in an historical context in which employers, since the 1890s, have been consistently pragmatic in their quest for low wages.
There is a widespread recognition that a genuine economic expansion - something less than a Miracle but more than a recovery - would reverse labour market conditions. Hence the strong support by established employers for the RBA, which automatically generates a high interest response to "unsustainable" growth rates or to any suggestion that wage settlements, on average, might rise above the inflation rate. With high interest rates hurting new businesses more than established interests, the support within the business establishment for the ECA/RBA duet is virtually unanimous.
While unemployment and underemployment remain a problem, overemployment is emerging as a parallel problem. The emergence of part-time work reflects both conditions. Falling real wages have made the single breadwinner family an institution of the past. Parents who would like to stay home now have little choice but to seek work. New Zealand is becoming a place in which either both parents work for wages, or neither parent works. When full-time workers lose their jobs, there is little point in their partners keeping their part-time jobs, given the rates at which social welfare assistance is abated.
The extent to which part-time jobs are becoming the new norm for job-seekers is disguised by the fact that the HLFS measure is one of workers rather than jobs. One feature of the new environment is the growing number of people with two or more jobs. Full-time workers with two jobs, each part-time, are no longer unusual.28 There has been a significant increase in the total number of hours being worked by each employed person, while the number working less than 30 hours per week has also been rising. There has been a proportionate decline in people working 30-40 hours per week on a regular basis. According to the HLFS, over 19 percent of workers were working over 50 hours per week in 1995, up from 15-16 percent throughout the late-1980s.
It was expected that the ECA would lead to rises in labour productivity. This has not eventuated, in the sense that labour productivity refers to output per hour supplied, output per hour worked or output per unit of effort supplied. Table 2 summarises labour productivity growth rates during the liberalisation period. With GDP growth running at six percent in 1995, five percentage points of that growth can be attributed to increased hours worked. There have been productivity gains per worker, but they are almost entirely a result of increased workloads,29 whereas in the past they were due mainly to technology, education, economies of scale (rises in total factor productivity) and changes in the capital-labour ratio.

The ECA has facilitated high expenditure and output per dollar paid in wages, which is of course productivity as employers understand it. So far the ECA has constituted an effective wage freeze in the private sector which has been backed up by more stringent measures in the public sector. The exception has been the top few percent of salary earners in the private sector, whose salary increases have been assessed by the NZ Higher Salaries Commission as the basis for determining the pay of politicians, judges and senior bureaucrats. These high salary recipients have not had their wages frozen. For example, the Chief District Court Judge has gained a pay increase of 12 percent in the three years to 1994; the Leader of the Opposition's pay has increased by 9 percent.30 The Higher Salaries Commission mechanism is a convenient way by which policymakers ensure they get rewarded for inequitable policies without actually setting their own remuneration. New Zealand's neo-liberal economic reforms have been a great success from the perspective of the community of interest which promoted the liberalisation process.
Income Distribution
The pace at which inequality increased in the UK was faster than in any other, with the exception of New Zealand.
It is no coincidence that the biggest increase in income inequalities have occurred in economies such as those of America, Britain and New Zealand, where free market economic policies have been pursued most zealously.
There can be little doubt that there has been a transformation in the pattern of income distribution in New Zealand, and that the shift has been towards both inequality and injustice. The most critical elements of this shift have been the rise in joblessness, the huge tax cut granted to high income earners in 1988,31 the increased emphasis on consumption taxes which cover all items except financial services,32 the Employment Contracts Act, the 1991 cuts in social welfare benefits (Mowbray 1993, p.20; Rankin 1995c), and the "sinking lid" policy on government expenditure (which involves both a wage freeze for the majority of public sector employees and increased private contributions towards health care and education33). The last three circumstances all occurred after the last income census, and after the data period used in the Joseph Rowntree Report.34 Poverty became a much more serious problem from 1991.35

Personal income distribution is a combined result of the division of income between factor funds (eg between the profit fund or "operating surplus" of the national accounts, and the wage/salary pool or "compensation of employees") and the division of income within funds.36 In the early 1980s, the operating surplus was 50 percent of the compensation of employees; in the year to March 1994, the ratio had climbed to 80 percent.
The patterns of long-term income distribution have been determined from median ratios of income to GDP (Rankin 1994, p.207) and from a more detailed study of the post-war income census (Rankin 1993a). From 1980/81 to 1990/91, real median incomes fell sharply, especially for young New Zealanders and men. There was a marked increase in inequality in the division of both the wage/salary pool and the operating surplus, with the average income of self-employed males falling below the average income of wage earners for each age group. Self-employment has become, for increasing numbers, another form of underemployment or disguised unemployment. For other self-employed workers, very long hours are required in order to earn the equivalent of the average wage.
It is clear that median income earners are worse off than in 1987, in absolute terms, relative to GDP, and relative to what would have occurred had the neo-liberal policy agenda not been implemented. Table 3 shows how, since 1991, the average wage rate has fallen in real terms, and in relation to national accounting aggregates.
Conclusion
[There are] two great economic problems: slow growth in productivity, and rising poverty. Everything else is either of secondary importance or a non-issue.
All of New Zealand's "magic square" indicators, though unremarkable, look to be signs of economic success when taken at the 1994/95 business cycle peak. Such an assessment ignores the historical context that is required to explain what the indicators actually mean for New Zealanders. Once translated into meaningful socio-economic indicators - developments in prosperity and justice, in productivity and equality - the gap between New Zealand and other developed economies continues to widen.
New Zealand's 1993-95 growth experience is no more than a recovery. New Zealand is not reaping productivity gains from restructuring. The main reasons for inadequate growth are probably the risk-averse investment strategies necessitated by macroeconomic policies that err on the side of deflation. Key policymakers fail to understand that, in our present historical context, annual GDP growth rates of over five percent per annum are neither inflationary nor unsustainable.
New Zealand desperately needs the rapid growth that it is at present capable of achieving. Faster growth in the 1990s can set the scene for sustainable productivity growth next century. Economic historian Colin Forster (1981, p.64) has noted that, as a result of Australia's long expansion towards the end of the nineteenth century, workers came to be more concerned with reducing their hours of work than in raising their wage rates. We need to once again create conditions in which workers, feeling that their contributions are fairly rewarded, will choose to give up annual salary increases for shorter working hours. A real economic Miracle means short working lives, high incomes per unit of labour supplied, an equitable allocation of work, and high rates of total factor productivity growth. Is it possible to create such a Miracle economy? Certainly not through the zealous pursuit of a doctrine that serves a narrow but influential community of interest; a community which, in the ruthless pursuit of profit, seeks to minimise its wages, taxes and other input prices.
References
Alliance (1995) A Plan for All New Zealanders, Alliance Alternative Budget.
Anderton, Jim (1995) "Anderton Bites Back over FTT" The Independent, 11 August.
Bayliss, Len (1994) Prosperity Mislaid, Wellington, GP Publications.
BBC (1992) "A Fable from the Age of Science", Pandora's Box television documentary series.
Birch, Bill (1995) "The Tax Agenda", National Business Review, Auckland; 28 April, 5 May, 12 May.
Bradford, Colin (1994) From Trade-Driven Growth to Growth-Driven Trade, Paris, Development Centre, OECD.
Brash, Don (1994) "Controls on Inflation remain Sustainable" NZ Herald, 18 November, p.8.
Brash, Don (1995) "Why the Kiwi Tiger is too Old for Rapid Growth" The Independent, 9 June.
Callick, Rowan (1995a) "New Zealand Ahead at Half-time" Australian Financial Review, 19 June.
Callick, Rowan (1995b) "New Zealand - Would-be Winners" Australian Financial Review, 20 June.
Chapman, Bruce ed. (1989) Australian Economic Growth (ed.), Melbourne, Macmillan.
Chisholm, Donna (1995) "Banks 'made up the rules as they went'", Sunday Star-Times, 6 August.
Conway, Matt (1995) "Computer Drives Workers", Sunday Star-Times, 23 April.
Crocombe, Graham, Michael Enright, Michael Porter (1991) Upgrading New Zealand's Competitive Advantage, Auckland, Oxford University Press.
Deeks, John (1994) Labour and Employment Relations in New Zealand, 2nd ed.; Auckland, Longman Paul.
Deeks, John (1989) Labour Relations in New Zealand; Auckland, Longman Paul.
Dixon, Sylvia (1993) "Alternative Measures of Employment and Unemployment", Key Statistics, Wellington, Statistics New Zealand, April.
Dowrick, Steve and Nguyen, Tom (1989) "Measurement and International Comparison", in Chapman.
Easton, Brian (1994a) "Friends in High Places; Rogernomic Policies have powerful allies in Australia" New Zealand Listener 23 April.
Easton, Brian (1994b) "Poorer, but Wiser" New Zealand Listener 17 December.
Edlin, Bob (1995a) "Import Figures offer a Whiff of Comfort", Sunday Star-Times, 6 August.
Edlin, Bob (1995b) "The Best-Qualified Cooks and Bottle Washers in Town" The Independent, 25 August.
Forster, Colin (1981) "Australian and Japanese Economic Development", in Japan & Australia; two societies and their interaction, Canberra, Australian National University Press.
Hirschman, Albert O. (1958) The Strategy of Economic Development.
Hirschman, Albert O. (1994) "The On-and-Off Connection between Political and Economic Progress", American Economic Review Papers and Proceedings 84(2):343-348.
INFOS, Statistics New Zealand (formerly the NZ Department of Statistics), computer database.
Joseph Rowntree Foundation (1995) Inquiry into Income and Wealth, York, Joseph Rowntree Foundation.
Kelsey, Jane & O'Brien, Mike (1995) Setting the Record Straight; a Response to the New Zealand Government's Paper to the Social Development Summit, Copenhagen, March 1995.
Krugman, Paul (1994) Peddling Prosperity, New York, Norton.
Moss, F.J. (1897) Notes on Political Economy by a New Zealand Colonist, London, Macmillan.
Mowbray, Mary (1993) Incomes Monitoring Report 1981-1991, Wellington, Social Policy Agency, Department of Social Welfare.
National Bank of New Zealand (1995) Business Outlook, August.
Ninness, Greg (1995) "Kiwis Spending Less than they did in 1990", Sunday Star-Times, 25 June.
NZ Department of Statistics (1988) Monthly Abstract of Statistics, November-December.
NZ Herald (1994) "Foodbanks in a Boom", Editorial, 16 September.
NZIER (1995) Quarterly Survey of Business Opinion.
OECD (1984) Economic Outlook, December, Paris.
OECD (1994a) Economic Survey of New Zealand, Paris (October).
OECD (1994b) Labour Force Statistics, Paris.
Olson, Mancur (1982) The Rise and Decline of Nations; Economic Growth, Stagflation, and Social Rigidities, New Haven, Yale University Press.
O'Neill, Steve (1993) "Labour Market Deregulation: the New Zealand Experience", Labour Market Papers, Parliamentary Research Service, Subject Collection No. 2, Dept. Of the Parliamentary Library, Canberra, Australian Government Publishing Service.
Preston, David (1995) "Reforming the Income Support System", internal paper, Social Policy Agency, NZ Department of Social Welfare, Wellington.
Rankin, Keith (1991) Protection vs. free trade; the New Zealand debates in the 1870s & 1880s, University of Auckland Economics Department Working Paper # 92.
Rankin, Keith (1993a) "Are New Zealanders Getting Poorer?" New Zealand Political Review, May/June, 2(1):11-15.
Rankin, Keith (1993b) "The New Zealand Workforce: 1950-2000", New Zealand Journal of Industrial Relations, 18(2): 214-235.
Rankin, Keith (1994) "Comment: How Great was the Depression in New Zealand? Neglected Estimates of Inter-War Aggregate Income", New Zealand Economic Papers 28(2):205-209.
Rankin, Keith (1995a) "Is New Zealand's Growth Rate Exceptional?", The Independent, 3 February.
Rankin, Keith (1995b) "Reserve Bank Fights Inflation while Fuelling it", The Independent, 10 February.
Rankin, Keith (1995c) "Setting the power of Benefits; a matter for Parliament", The Independent, February 24.
Rankin, Keith (1995d) "Employment is Up, but is Unemployment Really Solved?", The Independent, 3 March.
Rankin, Keith (1995e) "Economic Recovery: Driven by Productivity Growth or Labour Supply?", The Independent, 23 June.
Rankin, Keith (1995f) "Is New Zealand's Short Term Growth too Slow?", The Independent, 23 June.
Roger, Scott (1994) "Alternative Measures of Underlying Inflation: Further Results", New Zealand Reserve Bank Bulletin, 57(4):330-338.
Rosenberg, Wolfgang (1986) The Magic Square: what every New Zealander should know about Rogernomics and the alternatives, Christchurch, New Zealand Monthly Review Society.
Rudman, R.S. (1974) "Employer Organisations: their Development and Role in Industrial Relations" in John M. Howells et.al. eds. Labour and Industrial Relations in New Zealand; Pitman (Aust.).
Ryan, Denise (1995) "Across the Tasman", Sunday Star-Times, 1 January.
Saunders, Peter (1994) "Rising on the Tasman Tide: Income Inequality in Australia and New Zealand in the 1980s", Social Policy Research Centre Discussion Paper 49, University of New South Wales. (Published in Social Policy Journal of New Zealand 2, July 1994)
Schumpeter, J.A. (1934) The Theory of Economic Development, Cambridge, Mass., Harvard UP.
Schwartz, Herman (1994a) "Small States in Big Trouble; State Reorganization in Australia, Denmark, New Zealand, and Sweden in the 1980s", World Politics 46(4):527-555.
Schwartz, Herman (1994b) "Public Choice Theory and Public Choices; Bureaucrats and State Reorganization in Australia, Denmark, New Zealand, and Sweden in the 1980s", Administration and Society 26(1):44-77.
Sloan, Judith (1994) Towards Full Employment in New Zealand, New Zealand Business Roundtable.
Smellie, Patrick (1995) "Cracking the Magic 5%", The Independent, 15 September.
Statistics New Zealand Population Census, Household Labour Force Survey (HLFS), INFOS database.
Summers, Robert and Alan Heston (1991) "The Penn World Table (Mark 5): An Expanded Set Of International Comparisons, 1950-1988", Quarterly Journal of Economics, 106(2), 327-368.
Wood, Alan (1995) "Growing Pains for Economic Tigers", Sunday Star-Times, 8 January.
==============================
Notes:
© 1995 Keith Rankin